Why Businesses Are Moving from Excel to Power BI (Power BI vs Excel)
If you’ve ever stared at a wall of Excel cells and thought, “There has to be a better way,” you’re not alone. Many teams still rely on spreadsheets to track sales, budgets, and performance, but more and more businesses are switching from Excel to Power BI for reporting and analytics. In this post, I’ll walk you through why this shift is happening and how it can help you work smarter, not harder.
Why Excel Still Feels So Familiar
Excel has been the go‑to tool for data in offices for decades. It’s great for:
- Quick calculations and financial modeling
- Small, one‑off reports
- Manual formatting and tweaking
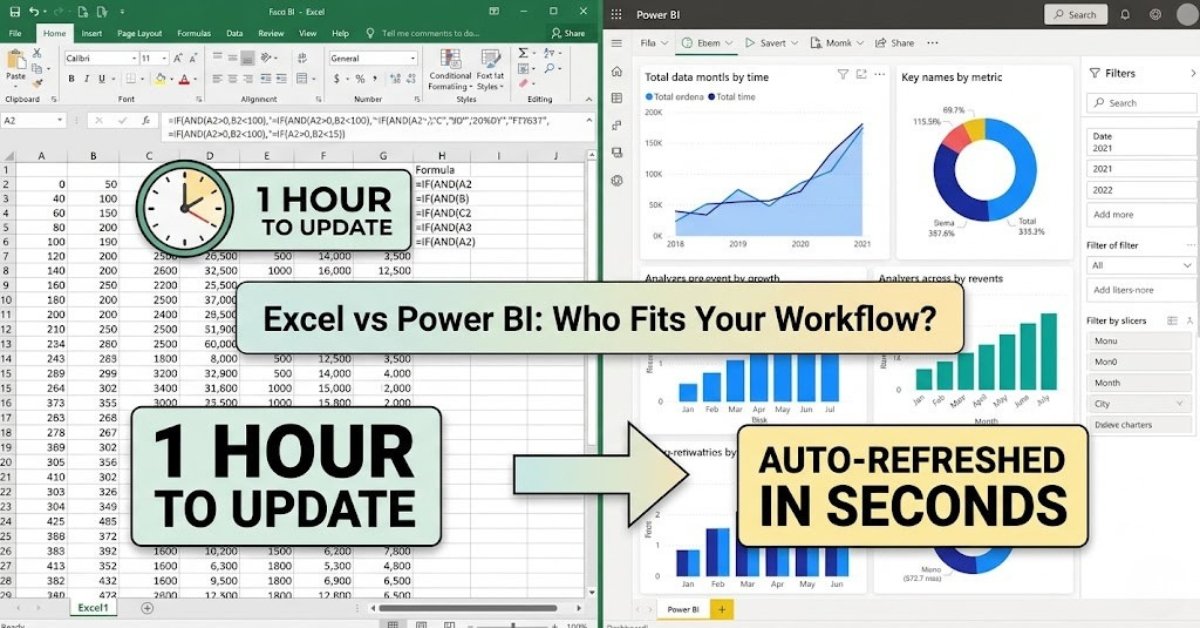
Most of us already know how to use Excel, so it’s natural to reach for it first. But when data grows, spreadsheets often become slow, messy, and hard to share.
Where Excel Starts to Struggle
As your business scales, Excel can turn from a helper into a headache:
- Performance issues with large datasets (tens of thousands of rows or more)
- Manual updates every time numbers change
- Version confusion when multiple people edit the same file
- Limited visuals compared to modern dashboards
Teams then spend hours copying data, refreshing formulas, and fixing errors—time that could be spent on real analysis.
What Power BI Actually Does
Power BI is a business intelligence platform built to connect to your data (like Excel, SQL, Google Sheets, or cloud apps) and turn it into live dashboards. Instead of waiting for someone to email you a report, you can log into Power BI and see:
- Real‑time KPIs (revenue, leads, conversions)
- Interactive charts and filters
- Different views for sales, marketing, finance, and operations
It’s like upgrading from Polaroid photos to a live video feed of your business.
Power BI vs Excel: Key Differences
You don’t need to drop Excel completely, but it’s important to understand how these two tools differ.
- Scope
- Excel = personal or small‑team analysis
- Power BI = company‑wide reporting and dashboards
- Data size and speed
- Excel works well for small to medium datasets
- Power BI handles millions of rows more smoothly
- Automation
- Excel often needs manual refresh and copying
- Power BI can auto‑refresh data and schedule reports
- Sharing and collaboration
- Excel files are shared as attachments or links
- Power BI lets you share live dashboards inside your organization
You can actually use both: keep Excel for detailed calculations and prep, and Power BI for visualization and sharing.
Why Businesses Are Making the Switch
Here’s what real teams are experiencing when they move from Excel to Power BI:
- Less time on manual work
Dashboards update automatically, so you don’t recalculate every month. - Faster decision‑making
Managers can drill into data on the fly instead of waiting for a static report. - Better data quality
A single source of truth in Power BI reduces copy‑paste errors. - Easier collaboration
Different teams work from the same dataset without overwriting each other.
This shift is especially helpful for finance, sales operations, and marketing teams who deal with recurring reports.
When Excel Still Makes Sense
Power BI isn’t a replacement for every Excel use case. Excel is still stronger for:
- Detailed financial models
- Ad‑hoc what‑if analysis
- One‑off calculations and text formatting
Think of Excel as your “workshop” where you fine‑tune data, and Power BI as your “showroom” where you present it to others.
How to Start the Transition Smoothly
If you’re considering moving from Excel to Power BI, here’s a simple way to start:
- Pick one recurring report (for example, monthly sales by region)
- Clean and structure the data in Excel first
- Connect that data to Power BI and build a dashboard
- Share it with your team and get feedback
- Repeat for other key reports
This step‑by‑step approach helps people adapt without feeling overwhelmed.
For Whom This Makes the Biggest Impact
Power BI is especially valuable for:
- Leaders and managers who need a clear, up‑to‑date view of performance.
- Sales and marketing teams tracking leads, campaigns, and conversions.
- Operations teams monitoring inventory, delivery, or service metrics.
If your team is still mailing Excel files, begging for “the latest data,” or spending hours fixing broken sheets, exploring the Power BI vs Excel mix can be a game‑changer.
What You Can Do Next
If you’re interested in learning how small or mid‑sized teams can smoothly move from spreadsheets to smarter dashboards, check out the Power BI vs Excel blog on Data Inseyets site for practical examples and step‑by‑step guidance. The idea is not to throw away Excel, but to use each tool where it belongs.


0 Comments